19 Aug Wed 2009
I Am at a 1:1 Ratio on Energy Use by Mid-August
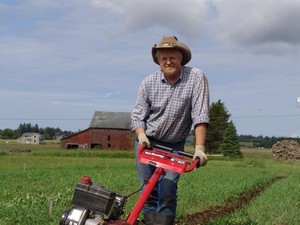
Regular readers of my blog know that I am very concerned with my carbon footprint, as measured in calories of energy used to produce calories of food. Last year I produced 2.2 million calories of food from 1.1 million calories of human sweat plus gas for my tillers. I have been tracking my realtime energy use on my spreadsheets this year and I have just crossed over into positive territory. So far, I have purchased 24 gallons of gas for my tillers, although I haven't used it all. I use the figure of 31,000 calories per gallon of gas to calculate calories of tiller gas used. I calculate my human calories at 125 calories per hour for 3000 hours per year and divide those 3000 hours into 8 months, 5 of which have already been counted (mid-March through mid-August). I track my yield as the produce comes in from the field and this year I am also tracking my grain. Each vegetable, fruit, or grain crop has a calorie value per pound or per pint (e.g. raspberries). The upshot is that I have now produced 984,092 calories for 980,111 calories of input by mid-August. This means my ratio is 1.004, or simply 1 calorie of output for every 1 calorie of input.
Of course there are flaws in my methodology, which are intentional for the most part. For example, my potato acreage for each variety I have started harvesting is already listed, so as I dig more potatoes, the ratio goes up. However, it was just simpler to keep track of square footage in this manner. What this means, though, is that my ratio goes up dramatically as the fall harvest progresses. The bottom line is the ratio at the end of the season. I am shooting for a target ratio of 5.00 this year and my realtime projections are 4.33 at this point. In other words, I am on track to produce between 4-5 times as much food in energy value as I consume in energy to produce that food. In the larger picture, this is what I need to do to produce enough food to feed 4 other people besides myself. The macro vision is a nation of farmers, where 20% of the adult population are fulltime farmers. This kind of spreadsheet analysis is how we get to that vision.

